
8.1.1How do I slice it?
Volumes by Slicing
LIME LAB, Part One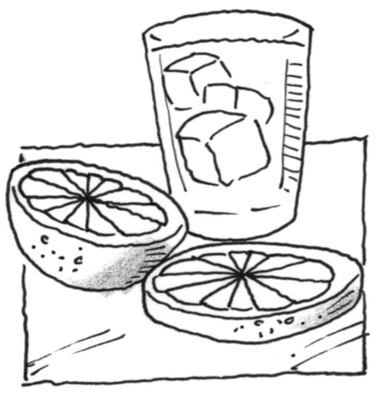
Simone has a part time job working as a waitress at a fine restaurant. While she enjoys her job, her thoughts are frequently directed towards her goal of becoming an engineer. One day, she looks at the sliced limes that are placed on each water glass and realizes that the slices can be used to estimate the volume of an entire lime. She promptly slices up a lime, creating cross-sections.
What is the geometric term that best describes the shape of each cross-section in this situation?
Using a similar slicing process, determine the volume of the lime provided by your teacher. Be sure to note the dimensions, units, and the method that you used.
Simone knows that by using the symmetry of the lime, a model of the lime can be generated by rotating a “flag.” Sketch the flag that will generate the shape of your lime when rotated.
LIME LAB, Part Two
The volume of the lime in problem 8-1 can be approximated with the volume of each slice.
By adding the volumes of successive slices, a Riemann sum is formed. Explain how the expression below represents this sum.
Explain how you can get an exact volume. Write an expression that will accomplish this.
.png)
Use his data to estimate the volume of the vase.
If Warren instead takes measurements every
cm, what will happen to the estimate? Continuing this process, describe how Warren should go about determining the exact volume of the vase.

Remember that
What does "
" by itself represent? What does the product
represent?

Sketch the region bounded by the curve
Draw a typical rectangle in the region and describe how the height and width are determined.
Set up and evaluate an integral to calculate the area of the region.
Evaluate

The value of a rare stamp was
What was the stamp worth in the year 2000?
What was the average value of the stamp from 1989 to 2000?

Use the graph of
For what values of
is undefined? For what values of
is discontinuous? For what values of
is non-differentiable?
.png)
Determine the following limits for


